Friday, May 4, 2007

Weekend Review - Can we go higher?


The Dow continues to close at record-breaking highs, above 13,000, while the S&P 500 and NASDAQ Composite are making new 6 years highs. Can we go higher? Our canaries - the big banks ($BKX), broker/dealers ($XBD), and housing ($HGX), continue to lag, though the brokers are looking better lately and are testing their 2007 highs set in January.

The QQQQ and IWM have bearish megaphone patterns, that show up very well on the weekly charts. Also, the CCI on the QQQQ is in a very overbought condition, above the +200 line. The same is true for DIA and SPY (not shown). It is rare for the weekly CCI to be so overbought. On the dailies, the QQQQ has a weakening Chaikin Osc, and we will be watching that trend line on the CCI. The daily IWM is looking stronger.

News: our Forum is open: http://glorytrades.com/forum/

Sunday, April 22, 2007

Weekend Review - Blast Off!!

The U.S. markets are blasting higher, with INDU making new all time highs this past week, and the SPX close to its own all time record high reached in 2000. BKX and XBD -- two of our "canaries" -- were also very strong last week, due to some good earnings reports, and the prospect for Congressional action to "bail out" lenders/borrowers with respect to problem housing loans. GSEs are also suddenly interested in buying subprime housing loans. http://www.washingtonpost.com/wp-dyn/content/article/2007/04/18/AR2007041802499.html?hpid=sec-business This news also helped our third "canary," the housing index, push higher last week. So much good news -- while the U.S. dollar hit a 26 year low against the British pound. The late February/March sell off earlier this year is a distant memory in the minds of "whoever" is buying here.

After retesting moving average support, noted in last wekend's review, the major U.S. indices switched to buy signals. This past week, our Aggressive Method remained on those buy signals for most of the U.S. indices, except one - the one we like to trade. It looks like we may be whipped out of a short in IWM. Details must be left for our members.

Oil (USO) broke down a bit last week and our Aggressive Method triggered a sell signal. Although USO had a good up day Friday, it is still below resistance of the 50 day MA.

Monday, April 16, 2007

Weekend Review


Gold (GLD) continues up -- no reason to get out of that long.
Oil (USO) gave us another long entry this week -- this was a "with trend" trade, for those who are following along.
On IWM and QQQQ -- traders following our Aggressive Mechanical Method (based on signals from Rodo) took profits on their longs this week and reversed to short. We warned clients, however, of the possibility that the U.S. equity indices would merely go down to touch moving average support and bounce back up -- which is exactly what they did.
All of the major U.S. equity indices we follow have filled their 2/27 gaps. NYA (the New York Stock Exchange index) has gone up to make a new all-time high. The economic problems that currently confront the United States are well known, and discussed thoroughly elsewhere. There is every reason for our stock markets to fall, except one: "There is too much cheap money floating around." With speculative money no longer going into housing, it needs to find a home somewhere, and it seems stocks are the place to be. Will the equity markets be the next bubble? Our "canary" sectors - banks, brokers, and housing - continue to lag the broad-based indices, with the housing index ($HGX) and the bank index ($BKX) still below their 200 day moving average. With the "canaries" so weak, we cannot be enthusiastic about the prospects for our markets, but we are not in the business of making predictions. The "bears" who warned about the Nasdaq bubble beginning in 1997 or so, were eventually proven correct, but they missed a great party !

Tuesday, April 10, 2007

Higher and Higher??


The major indices continue to claw their way up, and the going is slow. We are still long IWM and QQQQ. It does look like the Qs filled their gap from 2/27, as did IWM. The Qs came close to giving us a confirmed sell signal today, but it was a false alarm. Still, bearish divergences are showing up in the charts, most significantly on the chaikin osc.

Saturday, April 7, 2007

Weekend Review -- Keeping it Short

Gold continues its winning ways . . . the major U.S. indices are still clawing their way up, digging through their gaps from 2/27. Trading has been low volume and narrow for the most part. All the majors are now short term overbought.

Rodo got us out of our NDX short with profits, and into a long this past week. The other indices have held their long signals. Our canaries - housing, banks, and brokers - are still lagging, but they look a little frisky lately.

The index futures stopped trading at 9:15 a.m. for the Good Friday holiday, but not before they got a big boost from the strong jobs report released at 8:30. Unless something else happens this weekend, Monday Monday should be a strong open. Unless this time good news is bad. How can anyone trade off fundamental news when we cannot even tell whether or not the news is good news? Is good news bad now or is it good now? The charts know everything, which is why Glory just follows the charts.

(When we have time (LOL), we are going to go back and look at our buy/sell signals a few days prior to every Fed meeting. It should be enlightening.)

Friday, April 6, 2007

Update on USO


We received a confirmed "sell" signal on USO at the close of 3/30 for execution at the open on 4/2. This sell signal came from our new indicator "Rodo." (Please see the previous post about Rodo.)

Introducing "Rodo"

We have developed a set of 2 custom indicators that generate buy and sell signals for any market that can be charted. We have named one of them (the faster one) "Odo" and the other "Rod." Together we affectionately think of them as "Rodo." Applying Rodo to the markets/indices we follow, we get earlier, much better entries than waiting for our "pattern" trades to trigger -- the "pattern" trades are the trades illustrated in the charts posted here in the past. Rodo also gives many more trades and catches many more moves than that other method.

Rodo back tests very well on its own, but subjects us to a great deal of frustrating market chop. To avoid chop as much as possible (it is not always possible) we require confirmation of a new signal. This confirmation can come from any one of a number of indicators, based on either volume/money flow, momentum, or price. Sometimes, Rodo triggers a new signal that is confirmed the same day. In that case, we enter at the next day open. If the signal did not confirm the same day, we wait for the confirmation the next day, and enter intra-day when it does confirm. Rarely, we get such a strong, sudden move against our current signal, that we receive confirmation before we ever received a new signal from Rodo. In this case, we enter intra-day also.

This is probably as far as we will get in developing a "mechanical" trading system. We would not want to trade a "black box" system that blindly issues signals that have no real meaning to us. This system is not really a "discretionary" system as we have back tested it - it is very objective and precise. In back testing, Glory ignored things like price support/resistance, moving average support/resistance, double bottoms/tops, etc. -- things we would NOT ignore in real life trading.

We do not have a name for our "system" yet, but we are thinking of something along the lines of SETM -- Show Everyone The Money. :)

Saturday, March 31, 2007

Weekend Review -- Mixed, Flat, Stalled


Mixed, flat, stalled -- the only way to describe the U.S. equity markets. The strongest indices are $MID and $SML -- the S&P 400 mid caps and S&P 600 small caps. They are now both clearly in up trends (as we define an "up trend" in our system), but not yet strong, as the 50 CCI has yet to breach +100, though it has breached +50 on both. They have TC long set ups that triggered Friday, but just barely. Both have trend line resistance right overhead.

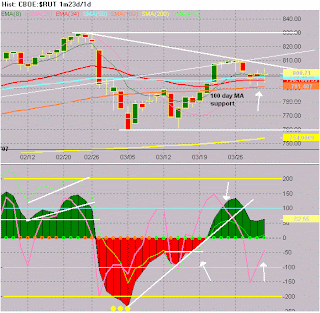
$SPX, $RUT, and $NDX are "muddled." None of them qualified for a change of trend to UP by the time TC shorts triggered. But in the recent rally off the March lows, all three did manage to trade above their 50 day MAs, pulling the 50 CCI above the zero line, holding for a few days. Yet the 50 CCI has not yet or barely breached even +50. The $RUT is the strongest of the three; the $NDX is the weakest. Our recent TC short in the $RUT was stopped out for a small profit last week, while our $NDX short is still with us. At the present time, the $RUT (barely) qualifies for a TC long. It has been finding support at the 100 day MA, and closing above its 50 day MA. But, trend line resistance right above.

$INDU and our "canary" sectors, $XBD (broker-dealers), $BKX (banks), and $HGX (housing), are clearly still in downtrends, as they did not even retake their 50 day MAs in the rally off the lows. All triggered TC shorts last week and are still on their short signals. Housing is the weakest, having rebreached its 200 day MA, and with the 50 CCI below -100. Banks and brokers are still holding above their 200 day MAs. $INDU never got close to breaching its 200 day MA in the sell off, and is the strongest of the four. Banks and brokers are also looking a bit "frisky," while housing, very oversold again, looks "dead in the water".

Money flow indicators don't look bad at all for most of the indices, except the banks, brokers and housing. (In fact, money flow is very strong in most of the indices.) The problems with housing are by now well known. There is also a great deal of concern by market participants that the large brokers and banks will see some fall out from the sub-prime time bomb that is hitting housing. Housing has been weak for years, as the $HGX topped out in 2005, and the big brokers, $XBD, topped out in January of this year.

So yes, all is well with the economy and the markets, except for housing, banks and the big Wall Street firms. That is like a doctor telling his patient that he is in great health except for the large spear sticking out of his chest!

Commodities


Gold (GLD) is still in an up trend, currently holding its long signal, though it is not strong. Silver (SLV) is weak and choppy. Oil (USO, the oil trust) is our star -- in a strong up trend and currently holding its long signal. (USO can be a good way to trade oil, for those who do not want to hold futures overnight.) The current long signal triggered on 3/21 at $48.80. It is now short term overbought, and has bearish divergences on a few of the indicators we watch, including the CCI 6 (shown) -- a warning that it may be overdone.

Wednesday, March 28, 2007

Thank You, Bears.

From yesterday's comments: On Monday, the . . . housing numbers drove the indices below their Friday lows, triggering the shorts on those markets that did not trigger on Friday . . . No denying that technically, our shorts triggered, but . . . The bears need to step up and assert themselves quickly . . .

Today, more problems with the housing market (last night it was revealed that BZH is under federal investigation for fraud), and very weak durables goods numbers released before the open, had the futures gaping down below Tuesday's lows. A great way to start the day if you're short.

We really love our TC (trend continuation) set ups. Stops now moved down to lock in some profit, and we are in a "cannot lose" position on our shorts.

Tuesday, March 27, 2007

Bull or Bear?

On Monday, the "bad, very bad" housing numbers drove the indices below their Friday lows, triggering the shorts on those markets that did not trigger on Friday. Today, more bad news from consumer confidence helped with some follow through.

One has to respect that fact that most of the major indices (no, not the INDU or the OEX) were able to break back above their 50 day MAs and are holding so far. Although the majors look strong when viewed from the move off the bottoms, we still do not have a strong indication of a trend reversal, with the 50 CCI staying below +100. The RUT and MID have trend line resistance right overhead, and all the indices have that terrible gap from 2/27. Our "canary" sectors remain weak.

So which way do we go? We have lots of "Fed head" talks the rest of the week, as well as economic news. So it is a toss up. No denying that technically, our shorts triggered, but if the indices hold their 50 day MAs a few more days, we will have a change of trend (in our system) to UP. The bears need to step up and assert themselves quickly or those gaps will fill in a hurry. And, although the indices are short term overbought, it is the end-of-month and end-of quarter which for some strange reason, always seem to have an upward bias. :)

Monday, March 26, 2007

Monday, Monday

The major indices look strong. Most have retaken their 50 day MAs (RUT, SPX, MID, NDX, but not OEX or INDU). "TC shorts" (Trend Continuation shorts) set up near the end of last week, but did not trigger, except on the NDX and the HGX, and even there, they barely qualified for a short. So anyone who took the long trades on most of the major indices are still long. We could get a trend change back to UP on the major indices. The warning, however, is that our "canary" sectors -- the banks, brokers, and home builders (BKX, XBD, HGX) -- are lagging. None of them broke their 50 day MAs in the exuberance of last week's buying.

Sunday, March 25, 2007

Are You Feeling Better Now?


(Click on chart to enlarge.)
Extreme selling followed by extreme buying. I hope the patient is doing better now.

A Rare Bullish Event


(Click on charts to enlarge.)

Even rarer, was the fact that we first had capitulation selling near a market top. These spikes in hard selling, spikes in the VIX, when occurring near market tops, usually are only the "first shoe" to drop. Yet now we have the rare "double 9-1" days, essentially capitulation buying, so soon? The breadth indicators that we track, such as bullish percent indices, did not get nearly as "oversold" as they did in the summer of 2006. The charts of these breadth indicators show what good bottoms look like. The recent sell off looks like just a correction in an ongoing uptrend. So far.

Thursday, March 22, 2007

Ratio Chart -- $BPSPX:$SPX

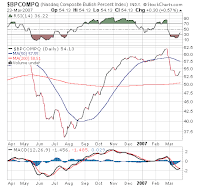
The recent sell off was NOTHING! The CCI didn't even get to the -200.

Wednesday, March 21, 2007

Gold Got Happy, too -- on March 15


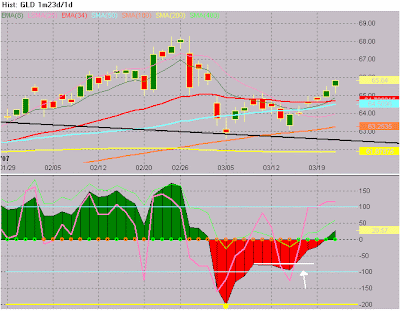
GLD triggered a buy signal on March 15.

WOW! The Fed made the markets happy!


And the "long" set ups worked. Many of the major indices had buy signals that triggered on Monday. Nice follow through today.

Monday, March 19, 2007

Which brings us to: Now -- It's Still about the Banks, stupid!


Again, the BKX acts as a harbinger of things to come. For those who believe that the recent market sell-off came "out of the blue," I might agree if only looking at my charts of the major U.S. indices. But while I had no "sell" signal on the INDU, SPX, RUT, or NDX, until it was "too late", the BKX had a beautiful, clear "sell" signal on Feb 23. (Not to mention that the XBD had been lagging the major indices, and Mother Merrill had a "sell" signal way back on Jan 25.)

A lesson About the BKX


The BKX often triggers clear buy and sell signals, either several days before the INDU and SPX have a signal, or many times, where there are no clear signals on the SPX or INDU at all.

Examples: In early Feb 2006, the SPX and INDU had no clear "buy" signals, while the BKX gave a beautiful "buy" signal on Feb 10 that preceded a nice rally in the other indices. In May 2006, the SPX did not have a "sell" signal until May 11, and the INDU May 12, after the sell off started; yet the "sell" signal triggered on the BKX on May 8, before the senior indices starting falling.


The RUT - My Favorite Index


Whichever way the RUT wants to go, I will follow.

Sample from the past: da BUS!!


Sample from the past: SNDK


SNDK can be a great trader. I wish it were always this easy.

Sample from the past: Lots of trades in FFIV


Sample from the past: BBBY long and short


Sample from the past: AMGN


An original short, with two opportunities to add to the profitable position, or re-enter if one already exited.

Sample from the past: MO long and short


In case you were wondering, the signals for the trades were not the zero line crosses. These were trend line breaks that were so close to the zero line, I did not draw them in.

Welcome to Glory Trades

My blog will focus on the U.S. indices, but I will sometimes post interesting charts of select stocks and sector ETFs.